数据网格视图(DataGrid View)
 jQuery EasyUI 扩展
数据网格详细视图(DataGrid DetailView)

用法
步骤 1:创建一个 HTML 页面
	<head>
		<script type="text/javascript" src="datagrid-detailview.js"></script>
	</head>
	<body>
		<table id="tt"></table>
	</body>
wø,3ø,xø,uø,e.com提供本在线速查手册,请勿盗用!
w∮3∮x∮u∮e.com提供本在线速查手册,请勿盗用!
步骤 2:创建数据网格(DataGrid)
	$(''#tt'').datagrid({
		title:''DataGrid - DetailView'',
		width:500,
		height:250,
		remoteSort:false,
		singleSelect:true,
		nowrap:false,
		fitColumns:true,
		url:''datagrid_data.json'',
		columns:[[
			{field:''itemid'',title:''Item ID'',width:80},
			{field:''productid'',title:''Product ID'',width:100,sortable:true},
			{field:''listprice'',title:''List Price'',width:80,align:''right'',sortable:true},
			{field:''unitcost'',title:''Unit Cost'',width:80,align:''right'',sortable:true},
			{field:''attr1'',title:''Attribute'',width:150,sortable:true},
			{field:''status'',title:''Status'',width:60,align:''center''}
		]],
		view: detailview,
		detailFormatter: function(rowIndex, rowData){
			return ''<table><tr>'' +
					''<td rowspan=2 style="border:0"><img src="images/'' + rowData.itemid + ''.png" style="height:50px;"></td>'' +
					''<td style="border:0">'' +
					''<p>Attribute: '' + rowData.attr1 + ''</p>'' +
					''<p>Status: '' + rowData.status + ''</p>'' +
					''</td>'' +
					''</tr></table>'';
		}
	});
wø,3ø,xø,uø,e.com提供本在线速查手册,请勿盗用!
w∮3∮x∮u∮e.com提供本在线速查手册,请勿盗用!
属性
| 名称 | 类型 | 描述 | 默认值 |
|---|---|---|---|
| detailFormatter | function(index,row) | 返回行明细内容的格式化函数。 |
事件
| 名称 | 参数 | 描述 |
|---|---|---|
| onExpandRow | index,row | 当展开一行时触发。 |
| onCollapseRow | index,row | 当折叠一行时触发。 |
方法
| 名称 | 参数 | 描述 |
|---|---|---|
| fixDetailRowHeight | index | 固定明细行的高度。 |
| getExpander | index | 获取行扩展对象。 |
| getRowDetail | index | 获取行明细容器。 |
| expandRow | index | 展开一行。 |
| collapseRow | index | 折叠一行。 |
数据网格分组视图(DataGrid GroupView)

用法
步骤 1:创建一个 HTML 页面
	<head>
		<script type="text/javascript" src="datagrid-groupview.js"></script>
	</head>
	<body>
		<table id="tt"></table>
	</body>
wø,3ø,xø,uø,e.com提供本在线速查手册,请勿盗用!
w∮3∮x∮u∮e.com提供本在线速查手册,请勿盗用!
步骤 2:创建数据网格(DataGrid)
	$(''#tt'').datagrid({
		title:''DataGrid - GroupView'',
		width:500,
		height:250,
		rownumbers:true,
		remoteSort:false,
		nowrap:false,
		fitColumns:true,
		url:''datagrid_data.json'',
		columns:[[
			{field:''productid'',title:''Product ID'',width:100,sortable:true},
			{field:''listprice'',title:''List Price'',width:80,align:''right'',sortable:true},
			{field:''unitcost'',title:''Unit Cost'',width:80,align:''right'',sortable:true},
			{field:''attr1'',title:''Attribute'',width:150,sortable:true},
			{field:''status'',title:''Status'',width:60,align:''center''}
		]],
		groupField:''productid'',
		view: groupview,
		groupFormatter:function(value, rows){
			return value + '' - '' + rows.length + '' Item(s)'';
		}
	});
wø,3ø,xø,uø,e.com提供本在线速查手册,请勿盗用!
w∮3∮x∮u∮e.com提供本在线速查手册,请勿盗用!
属性
| 名称 | 类型 | 描述 | 默认 |
|---|---|---|---|
| groupField | string | 指示要被分组的字段。 | |
| groupFormatter | function(value,rows) |
返回分组内容的格式化函数。 value 参数指示由 ''groupField'' 属性定义的分组值。 rows 参数根据指定分组值指示数据行。 |
方法
| 名称 | 参数 | 描述 |
|---|---|---|
| expandGroup | groupIndex | 展开一个分组。 |
| collapseGroup | groupIndex | 折叠一个分组。 |
数据网格缓存视图(DataGrid BufferView)

步骤 1:包含 ''datagrid-bufferview.js'' 文件
	<head>
		<script type="text/javascript" src="datagrid-bufferview.js"></script>
	</head>
wø,3ø,xø,uø,e.com提供本在线速查手册,请勿盗用!
w∮3∮x∮u∮e.com提供本在线速查手册,请勿盗用!
步骤 2:创建数据网格(DataGrid)
	<table id="tt" class="easyui-datagrid" style="width:700px;height:250px"
			title="DataGrid - BufferView"
			data-options="url:''get_data.php'',view:bufferview,rownumbers:true,singleSelect:true,autoRowHeight:false,pageSize:50">
		<thead>
			<tr>
				<th field="inv" width="80">Inv No</th>
				<th field="date" width="100">Date</th>
				<th field="name" width="80">Name</th>
				<th field="amount" width="80" align="right">Amount</th>
				<th field="price" width="80" align="right">Price</th>
				<th field="cost" width="100" align="right">Cost</th>
				<th field="note" width="110">Note</th>
			</tr>
		</thead>
	</table>
wø,3ø,xø,uø,e.com提供本在线速查手册,请勿盗用!
w∮3∮x∮u∮e.com提供本在线速查手册,请勿盗用!
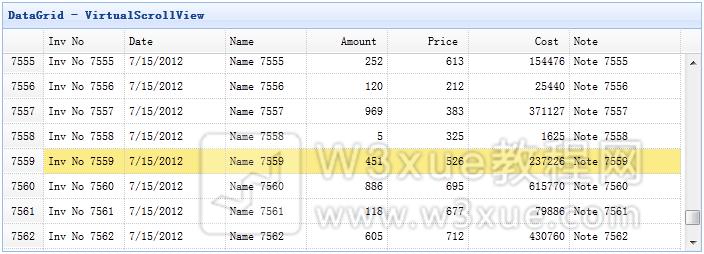
数据网格虚拟滚动视图(DataGrid VirtualScrollView)
步骤 1:包含 ''datagrid-scrollview.js'' 文件
	<head>
		<script type="text/javascript" src="datagrid-scrollview.js"></script>
	</head>
wø,3ø,xø,uø,e.com提供本在线速查手册,请勿盗用!
w∮3∮x∮u∮e.com提供本在线速查手册,请勿盗用!
步骤 2:通过虚拟滚动视图创建数据网格(DataGrid)
	<table id="tt" class="easyui-datagrid" style="width:700px;height:250px"
			title="DataGrid - VirtualScrollView"
			data-options="url:''get_data.php'',view:scrollview,rownumbers:true,singleSelect:true,autoRowHeight:false,pageSize:50">
		<thead>
			<tr>
				<th field="inv" width="80">Inv No</th>
				<th field="date" width="100">Date</th>
				<th field="name" width="80">Name</th>
				<th field="amount" width="80" align="right">Amount</th>
				<th field="price" width="80" align="right">Price</th>
				<th field="cost" width="100" align="right">Cost</th>
				<th field="note" width="110">Note</th>
			</tr>
		</thead>
	</table>
wø,3ø,xø,uø,e.com提供本在线速查手册,请勿盗用!
w∮3∮x∮u∮e.com提供本在线速查手册,请勿盗用!
下载 jQuery EasyUI 实例
jquery-easyui-datagridview.zip
jQuery EasyUI 扩展  本节优化或纠错