默认已安装Prometheus服务,服务地址:192.168.56.200
一、获取交换机snmp信息
snmp服务IP(交换机IP):172.20.2.83
snmp community:dfetest
二、部署 snmp_exporter
2.1 下载snmp_exporter
下载snmp_exporter安装包,下载地址:https://github.com/prometheus/snmp_exporter/releases
下载完成后,上传至机器的 /usr/local 目录下
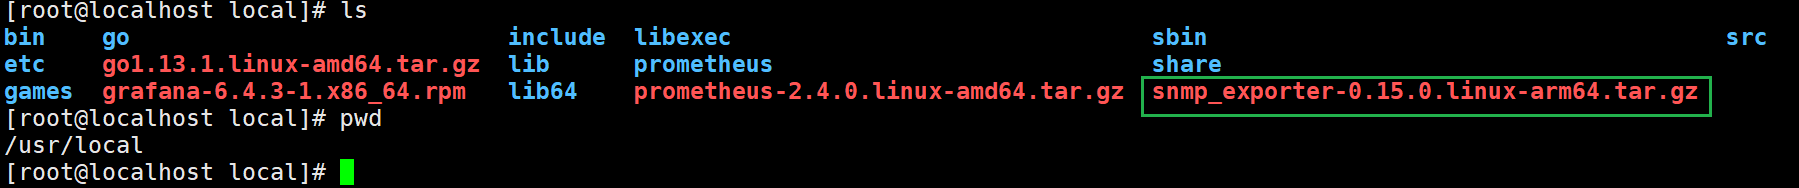
解压安装包
- # tar -zvxf snmp_exporter-0.15.0.linux-arm64.tar.gz
- # mv snmp_exporter-0.15.0.linux-arm64/ snmp_exporter
2.2 配置snmp_exporter
snmp_exporter的配置文件需要自己通过SNMP Exporter Config Generator 项目编译生成,
参考方法: https://github.com/prometheus/snmp_exporter/tree/master/generator#file-format
由于Prometheus使用go语言开发的,所以自己编译生成snmp_exporter的配置文件需要go环境,Linux中安装go环境可参考:https://www.cnblogs.com/guoxiangyue/p/11772717.html 中安装go环境章节
go环境安装以后,构建snmp exporter config Generator,执行以下操作:
- # yum -y install git
- # yum -y install gcc gcc-g++ make net-snmp net-snmp-utils net-snmp-libs net-snmp-devel
- # go get github.com/prometheus/snmp_exporter/generator
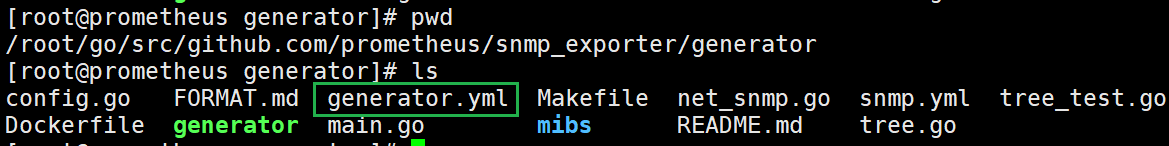
- # cd ${GOPATH-$HOME/go}/src/github.com/prometheus/snmp_exporter/generator
- # go build
- # make mibs
编译完成后,修改当前目录下的generator.yml 文件,generator.yml文件的配置可以参考 https://github.com/prometheus/snmp_exporter/tree/master/generator#file-format ,generator.yml文件中只需要注入snmp的community即可,下面仅修改了modules.if_mib.auth字段,其余与 File Format 中一致。
generator.yml 中module.if_mib.auth字段:
- modules:
- # Default IF-MIB interfaces table with ifIndex.
- if_mib:
- walk: [sysUpTime, interfaces, ifXTable]
- version: 1
- auth:
- community: dfetest
- lookups:
- - source_indexes: [ifIndex]
- lookup: ifAlias
- - source_indexes: [ifIndex]
- lookup: ifDescr
- - source_indexes: [ifIndex]
- # Use OID to avoid conflict with Netscaler NS-ROOT-MIB.
- lookup: 1.3.6.1.2.1.31.1.1.1.1 # ifName
- overrides:
- ifAlias:
- ignore: true # Lookup metric
- ifDescr:
- ignore: true # Lookup metric
- ifName:
- ignore: true # Lookup metric
- ifType:
- type: EnumAsInfo
修改完成后,保存退出,执行以下操作,生成新的 snmp.yml 文件
- # export MIBDIRS=mibs
- # ./generator generate
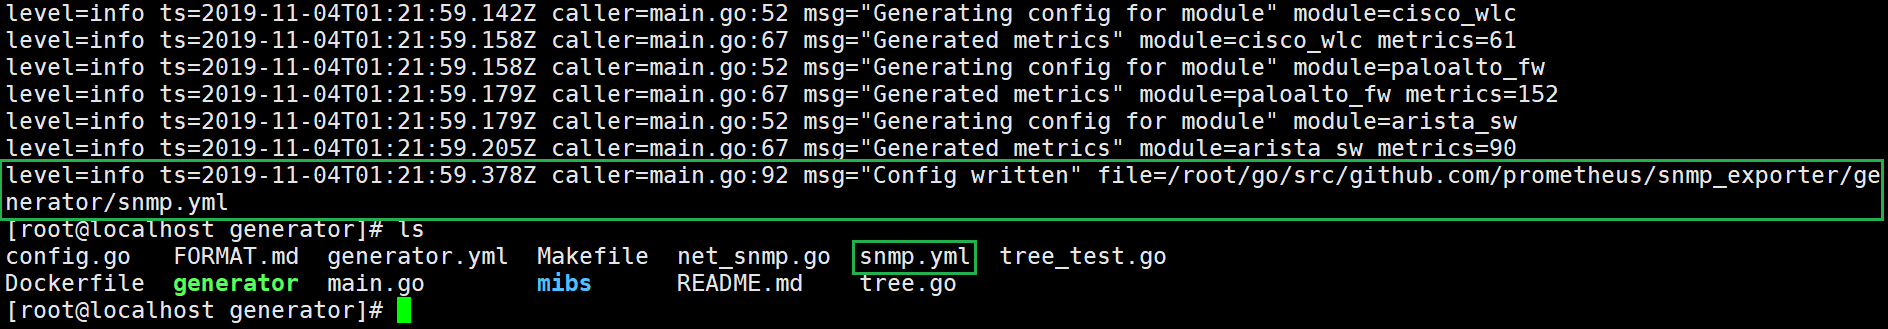
将新生成的snmp.yml 替换掉原snmp_exporter中的snmp.yml
- # cp snmp.yml /usr/local/snmp_exporter
2.3 验证并设置snmp_exporter 服务开机启动
- # cd /usr/local/snmp_exporter
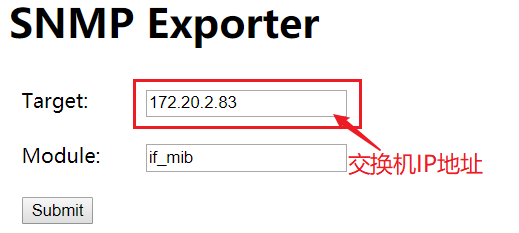
- # ./snmp_exporter

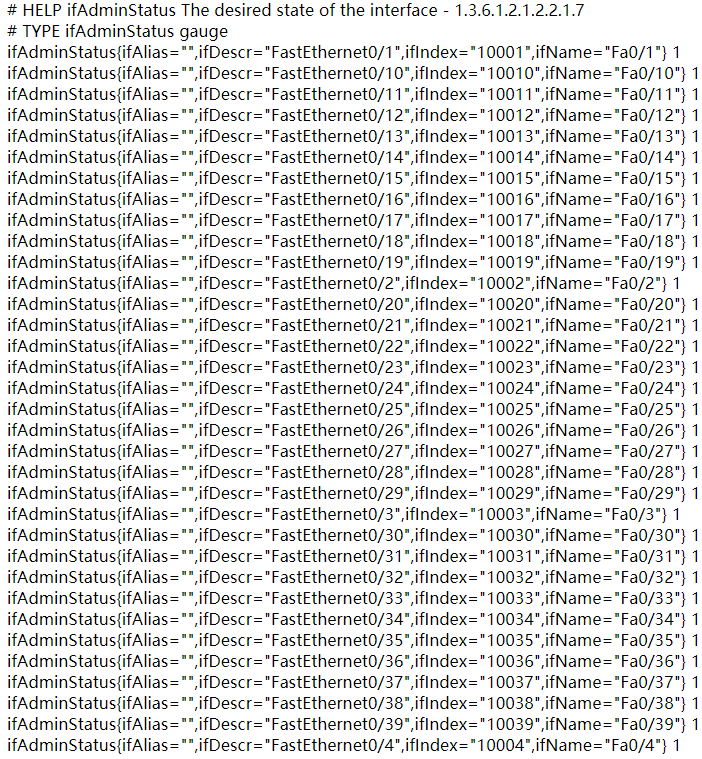
开启服务端口在9116上,浏览器访问 http://192.168.56.200:9116 , 在 Target 输入框中填入交换机IP地址,点击 submit 按钮,出现数据,在snmp_exporter 配置成功。
2.4 设置snmp_exporter 以服务方式,开机启动
Ctrl+C 结束掉 snmp_exporter 进程,创建 snmp_exporter 服务,让 snmp_exporter 以服务的方式,开机自启。
添加系统服务
- # vim /etc/systemd/system/snmp_exporter.service
将以下内容写入文件中
- [Unit]
- Description=node_exporter
- After=network.target
- [Service]
- ExecStart=/usr/local/snmp_exporter/snmp_exporter
- Restart=on-failure
- [Install]
- WantedBy=multi-user.target
启动服务,设置开机自启
- # systemctl daemon-reload
- # systemctl enable snmp_exporter
- # systemctl start snmp_exporter
三、修改Prometheus 配置
进入Prometheus的安装文件夹,打开Prometheus配置文件
- # cd /usr/local/prometheus
- # vim prometheus.yml
在scrape_configs标签下,添加以下内容,配置监控。params.module中可以配置需要抓取的模块,不配置表示全部抓取。
- - job_name: 'snmp'
- scrape_interval: 10s
- static_configs:
- - targets:
- - 172.20.2.83 # 交换机IP地址
- metrics_path: /snmp
- # params:
- # module: [if_mib]
- relabel_configs:
- - source_labels: [__address__]
- target_label: __param_target
- - source_labels: [__param_target]
- target_label: instance
- - target_label: __address__
- replacement: 192.168.56.200:9116 # snmp_exporter 服务IP地址
以下是Prometheus.yml 文件全部内容
- # my global config
- global:
- scrape_interval: 15s # Set the scrape interval to every 15 seconds. Default is every 1 minute.
- evaluation_interval: 15s # Evaluate rules every 15 seconds. The default is every 1 minute.
- # scrape_timeout is set to the global default (10s).
- # Alertmanager configuration
- alerting:
- alertmanagers:
- - static_configs:
- - targets:
- # - alertmanager:9093
- # Load rules once and periodically evaluate them according to the global 'evaluation_interval'.
- rule_files:
- # - "first_rules.yml"
- # - "second_rules.yml"
- # A scrape configuration containing exactly one endpoint to scrape:
- # Here it's Prometheus itself.
- scrape_configs:
- # The job name is added as a label `job=<job_name>` to any timeseries scraped from this config.
- - job_name: 'prometheus'
- # metrics_path defaults to '/metrics'
- # scheme defaults to 'http'.
- static_configs:
- - targets: ['localhost:9090']
- - job_name: 'Linux'
- static_configs:
- - targets: ['192.168.56.201:9100']
- labels:
- instance: Linux
- - job_name: 'Windows'
- static_configs:
- - targets: ['192.168.56.1:9182']
- labels:
- instance: Windows
- - job_name: 'snmp'
- scrape_interval: 10s
- static_configs:
- - targets:
- - 172.20.2.83 # 交换机IP地址
- metrics_path: /snmp
- # params:
- # module: [if_mib]
- relabel_configs:
- - source_labels: [__address__]
- target_label: __param_target
- - source_labels: [__param_target]
- target_label: instance
- - target_label: __address__
- replacement: 192.168.56.200:9116 # snmp_exporter 服务IP地址
保存退出,重启Prometheus服务
- # systemctl restart prometheus
浏览器访问 http://192.168.56.200:9090/targets 查看监控信息
 可以看到,snmp已经加入进来。
四、配置Grafana
添加dashboard
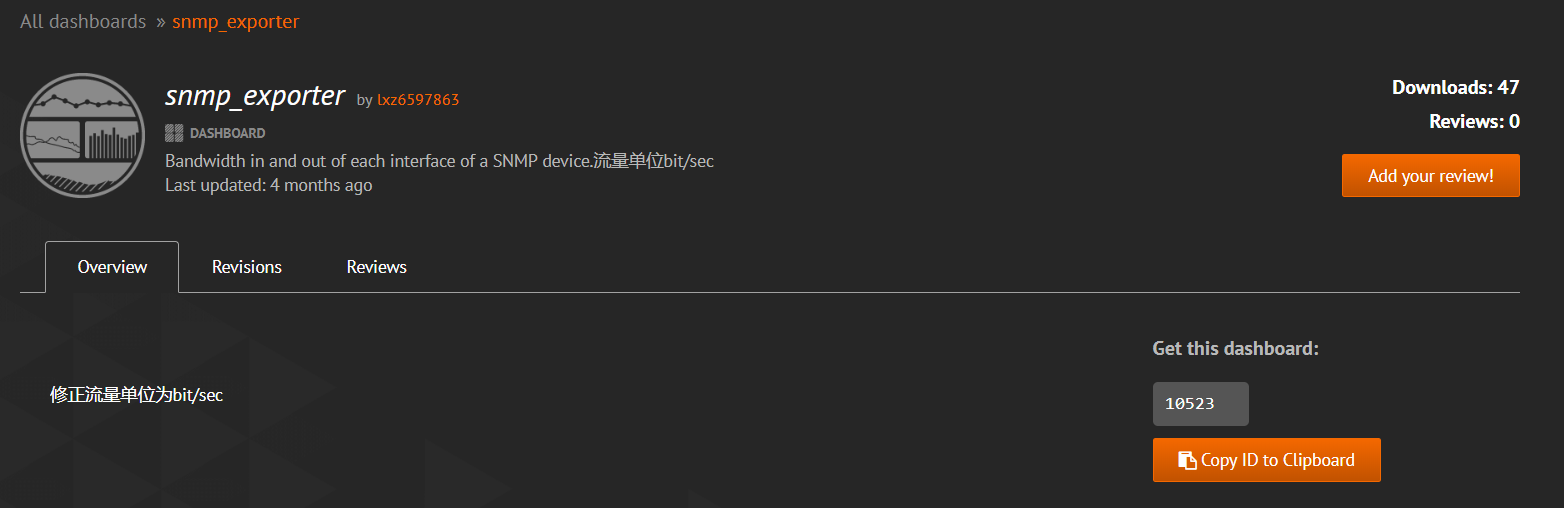
Grafana官方为我们提供了很多dashboard页面,可直接下载使用。浏览器访问 https://grafana.com/grafana/dashboards 下载所需要的dashboard页面
此处我们使用 snmp 的监控dashboard,dashboard Id为:10523
然后打开我们的Grafana监控页面,打开dashboard的管理页面

点击【import】按钮

然后将我们刚才的dashboard Id (10523) 复制进去
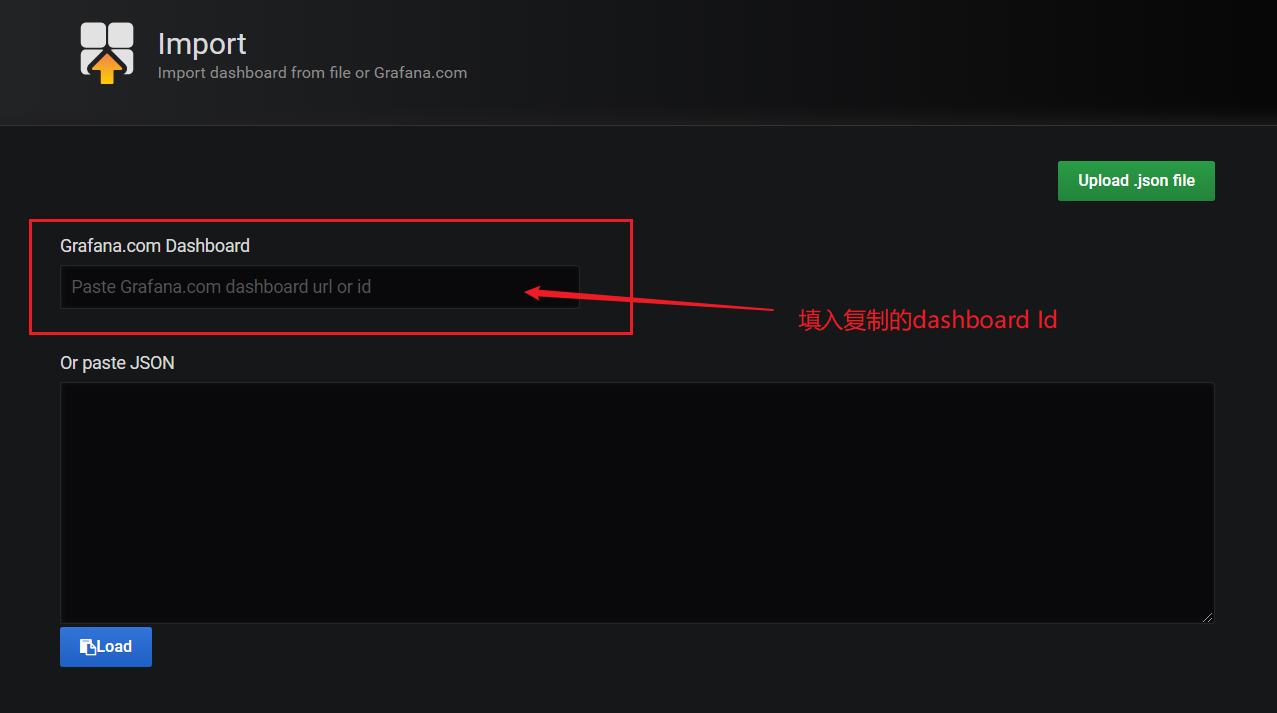
Grafana会自动识别dashboard Id 。
然后点击【change】按钮,生成一个随机的UID,然后点击下方输入框,选择我们之前创建的数据源Prometheus,最后点击【Import】按钮,即可完成导入。
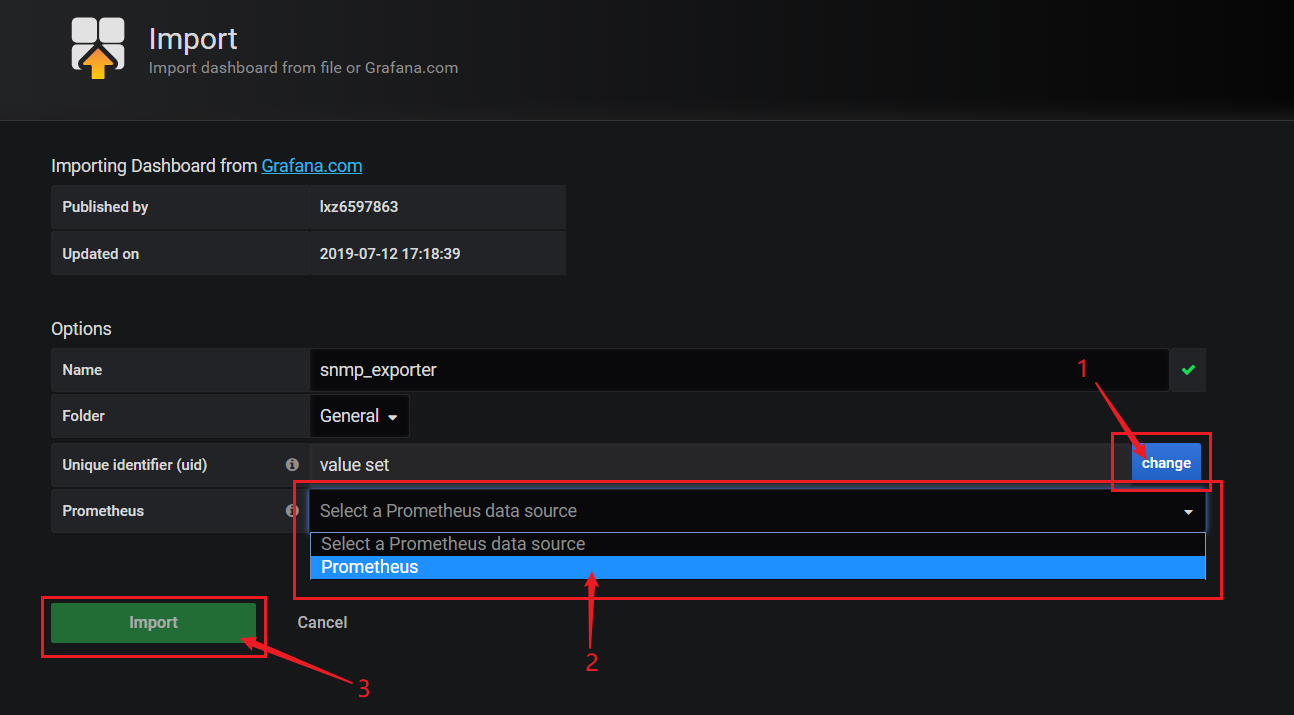
导入成功后,会自动打开该Dashboard,即可看到我们刚才设置好的snmp监控
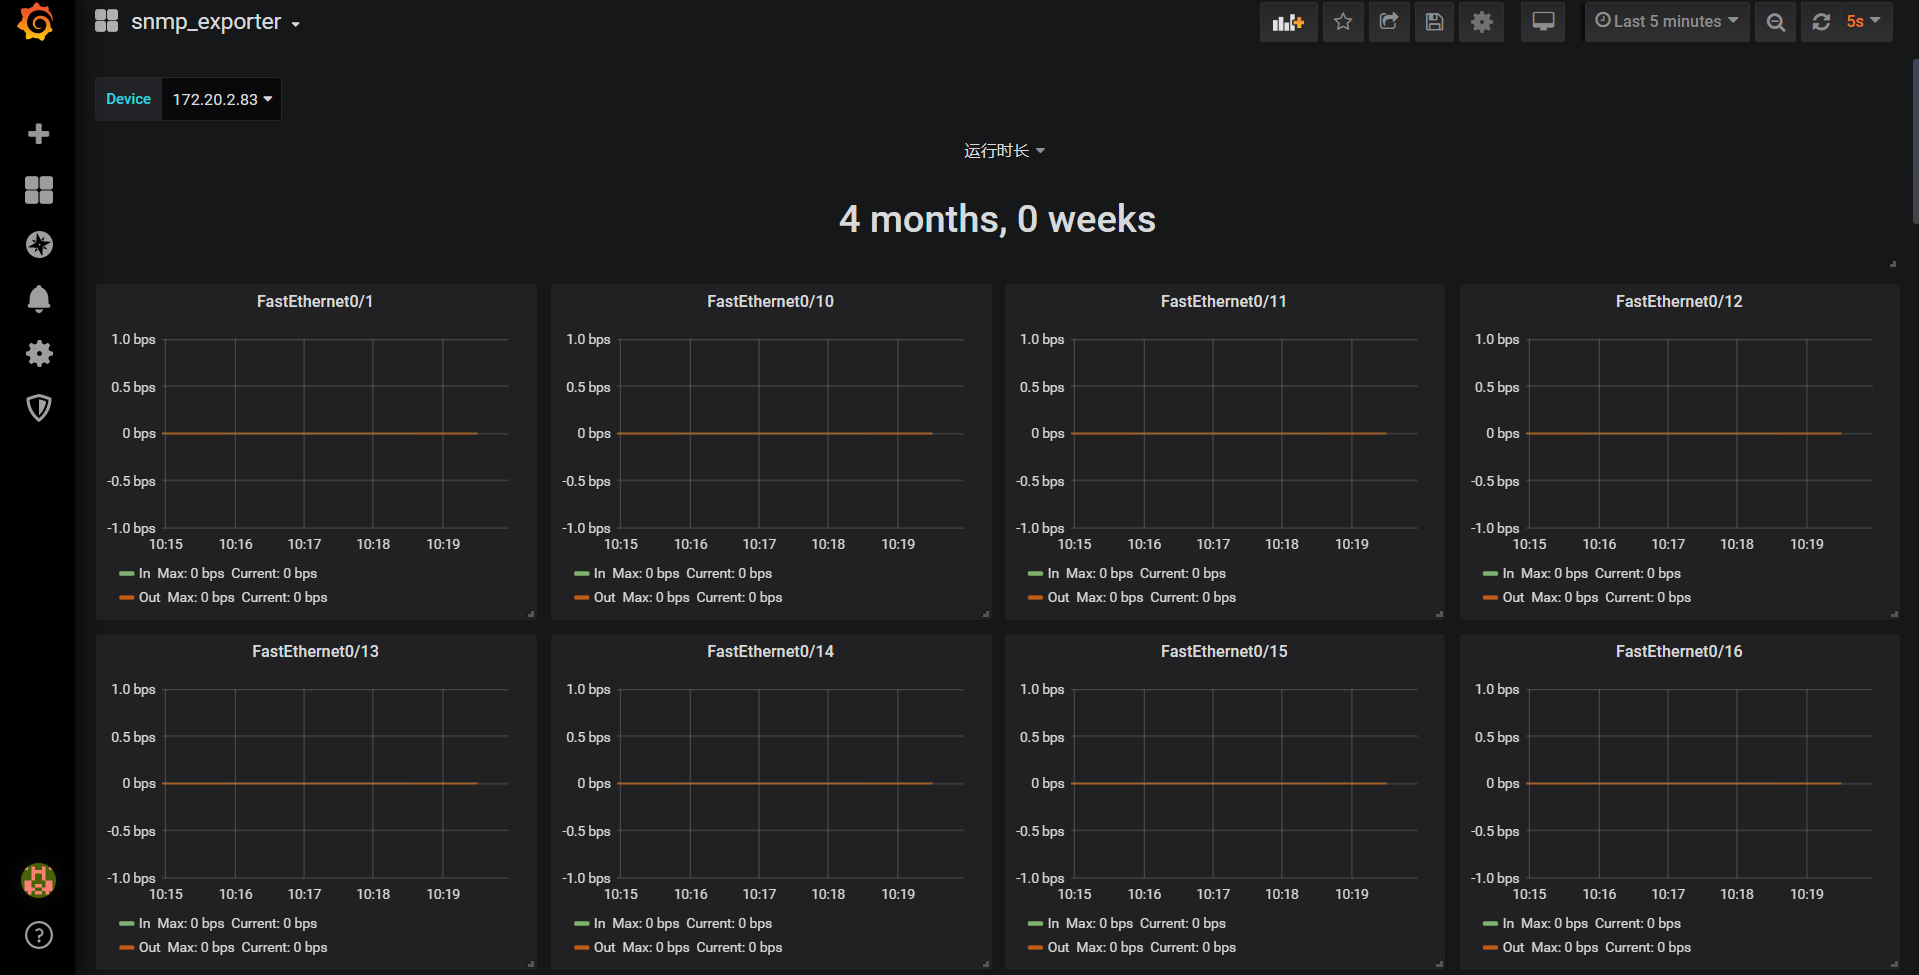
至此Prometheus监控交换机,配置完成。
