前言
我们做项目的时候,常常需要一些统计图来展示我们的数据,作为web开发人员,会实现统计图是我们必会的技能。我将带大家来实现动态饼图的实现
一、环境配置
1.1 安装acharts
- //npm也一样
- cnpm install echarts --save
1.2 全局引用
main.js中配置
- //引入 echarts
- import echarts from 'echarts'
- //注册组件
- Vue.prototype.$echarts = echarts
全局注册好组件之后就让我们进入正题吧,第一步先绘制圆环图吧。先上结果图:

二、圆环图前端实现
2.1 先在vue页面添加渲染盒子
- <template>
- <div class="test2" style="width:600px;height:400px;">
- <div id="myChart" style="width:100%;height:278px;float:left;"></div>
- </div>
- </template>
-
2.2 前端逻辑实现部分
引入echart
- import * as echarts from 'echarts'
注意:这里有一个大坑,如果你安装的是高版本的echarts,一定要按我这个来,import echarts from 'echarts'网上很多人都这么分享会发生init函数初始化错误
- <script>
- import * as echarts from 'echarts'
- export default {
- name: 'test2',
- data () {
- return {
- queryInfo: {
- query: "",
- pageNum: 1,
- pageSize: 4,//后端请求的数据类别4个,如果你有多个,就更改这个参数
- },
- queryInfof: {
- query: "",
- pageNum: 1,
- pageSize: 100,
- },
- myChart: '',
- opinionData2: [
-
- {"itemStyle":"#3F8FFF","name":"威胁攻击日志","value":200},
- {"itemStyle":"#6DC8EC","name":"审计url异常","value":388},
- {"itemStyle":"#1FC48D","name":"正常网络日志","value":5287},
- {"itemStyle":"red","name":"流量日志异常","value":320}
- ]
- }
- },
- mounted: function () {
- this.drawLine();
-
- },
-
- methods: {
- async drawLine () {
- // 调用post请求
- /* const { data: res } = await this.$http.get("alldate", {
- params: this.queryInfo
- });
- if (res.flag != "success") {
- return this.$message.error("该数据获取失败!!!");
- }
-
- console.log(res.flag)
- this.opinionData2 = res.opinionData2; // 将返回数据赋值*/
- this.myChart = echarts.init(document.getElementById('myChart'))
- this.myChart.setOption({
- title: {
- text: '网络日志异常流量分析', // 主标题
- subtext: '', // 副标题
- x: 'left' // x轴方向对齐方式
- },
- grid: { containLabel: true },
- tooltip: {
- trigger: 'item',
- formatter: '{a} <br/>{b} : {d}%'
- },
- // color: ['#1FC48D', '#F5A60A', '#6DC8EC', '#3F8FFF'],
- color: ['#1FC48D', 'red', '#6DC8EC', '#3F8FFF'],
- // backgroundColor: '#ffffff',
- legend: {
- orient: 'vertical',
- icon: 'circle',
- align: 'left',
- x: 'right',
- y: 'bottom',
- data: ['审计url异常', '正常网络日志', '流量日志异常', '威胁攻击日志']
- },
- series: [
- {
- name: '网络日志状态',
- type: 'pie',
- radius: ['50%', '70%'],
- avoidLabelOverlap: false,
- center: ['40%', '50%'],
- itemStyle: {
- emphasis: {
- shadowBlur: 10,
- shadowOffsetX: 0,
- shadowColor: 'rgba(0, 0, 0, 0.5)'
- },
- color: function (params) {
- // 自定义颜色
- var colorList = ['#1FC48D', 'red', '#6DC8EC', '#3F8FFF']
- return colorList[params.dataIndex]
- }
- },
- data: this.opinionData2
- }
- ]
- })
- },
- }
- }
- </script>
2.3 展示(可按自己需求更改前端样式)

三、前后端数据交互实现
3.1 创建数据库
表结构:(根据你的业务需要创建)

表数据

3.2 后台代码的编写
3.2.1 在bean包下创建QueryInfo类
该类实现得到前端请求的数据条数。相当于分页功能。
- public class QueryInfo {
- private String query;
- private int pageNum=1;
- private int pageSize=1;
-
- public QueryInfo() {
- }
-
- public QueryInfo(String query, int pageNum, int pageSize) {
- this.query = query;
- this.pageNum = pageNum;
- this.pageSize = pageSize;
- }
-
- public String getQuery() {
- return query;
- }
-
- public int getPageNum() {
- return pageNum;
- }
-
- public int getPageSize() {
- return pageSize;
- }
-
- public void setQuery(String query) {
- this.query = query;
- }
-
- public void setPageNum(int pageNum) {
- this.pageNum = pageNum;
- }
-
- public void setPageSize(int pageSize) {
- this.pageSize = pageSize;
- }
-
- @Override
- public String toString() {
- return "QueryInfo{" +
- "query='" + query + '\'' +
- ", pageNum=" + pageNum +
- ", pageSize=" + pageSize +
- '}';
- }
- }
3.2.2 在bean包下创建Showdate类
- public class Showdate {
- private String name;
- private String itemStyle;
- private int value;
-
-
- public Showdate() {
-
- }
-
- public Showdate(String name, String itemStyle, int value) {
- this.name = name;
- this.itemStyle = itemStyle;
- this.value = value;
- }
-
- public String getName() {
- return name;
- }
-
- public void setName1(String name) {
- this.name= name;
- }
-
- public String getItemStyle() {
- return itemStyle;
- }
-
- public void setItemStyle(String itemStyle) {
- this.itemStyle = itemStyle;
- }
-
- public int getValue() {
- return value;
- }
-
- public void setValue(int value) {
- this.value = value;
- }
-
- @Override
- public String toString() {
- return "Showdate{" +
- "name='" + name + '\'' +
- ", itemStyle='" + itemStyle + '\'' +
- ", value=" + value +
- '}';
- }
- }
3.2.3 在resources下创建Mapper
1.在Mapper中创建ShowDataMapper.xml
- <?xml version="1.0" encoding="UTF-8" ?>
- <!DOCTYPE mapper PUBLIC "-//mybatis.org//DTD Mapper 3.0//EN"
- "http://mybatis.org/dtd/mybatis-3-mapper.dtd">
-
- <mapper namespace="com.naughty.userlogin02.dao.ShowdateDao">
-
-
- <select id="getAlldate" resultType="com.naughty.userlogin02.bean.Showdate">
- SELECT * FROM date1
- <if test="name!=null ">
- WHERE name like #{name}
- </if>
- LIMIT #{pageStart},#{pageSize}
- </select>
-
- <update id="updatenew">
- UPDATE date1 SET value = #{count} WHERE name = #{name}
- </update>
-
-
- </mapper>
2.在resources下创建application.yml用于配置数据库和端口号
- # mysql
- spring:
- datasource:
- #MySQL配置
- driverClassName: com.mysql.cj.jdbc.Driver
- url: jdbc:mysql://localhost:3306/weblog?useUnicode=true&characterEncoding=UTF-8&useSSL=false&serverTimezone=UTC
- username: root
- password: root
-
- mybatis:
- mapper-locations: classpath:mapper/*.xml
- type-aliases-package: com.example.demo.model
- server:
- port: 9000
3.2.4 在Dao下创建ShowdateDao
里面有两个接口,如果你需要操作数据库,就需要在ShowdateDao中编写接口方法;
在ShowDataMapper.xml中编写sql语句。
我这里实现了修改和查找;
- import com.naughty.userlogin02.bean.Showdate;
- import org.apache.ibatis.annotations.Param;
- import org.springframework.stereotype.Repository;
-
- import java.util.List;
- @Repository
- public interface ShowdateDao {
-
- public List<Showdate> getAlldate(@Param("name") String name, @Param("pageStart") int pageStart, @Param("pageSize") int pageSize);
-
- public int updatenew(String name, int count);
- }
-
3.2.5 在Controller下创建ShowdateController
在ShowdateController中要注解使用空间
- @Autowired
- ShowdateDao showdateDao;//你需要传给前端的数据库表
- @Autowired
- FlowDao flowDao;//你的数据来源的效果数据库表
- package com.naughty.userlogin02.controller;
-
- import com.alibaba.fastjson.JSON;
- import com.naughty.userlogin02.bean.*;
- import com.naughty.userlogin02.dao.CheckDao;
- import com.naughty.userlogin02.dao.FlowDao;
- import com.naughty.userlogin02.dao.SafeDao;
- import com.naughty.userlogin02.dao.ShowdateDao;
- import org.springframework.beans.factory.annotation.Autowired;
- import org.springframework.web.bind.annotation.*;
-
- import java.util.HashMap;
- import java.util.List;
- import java.util.Stack;
-
- @RestController
- public class ShowdateController {
-
- @Autowired
- ShowdateDao showdateDao;
- @Autowired
- FlowDao flowDao;
- //前台刷新日志数据
- @CrossOrigin
- @RequestMapping("/alldate")//前端请求通道
- public String getAlldateList(QueryInfo queryInfo){
- System.out.println(queryInfo);
- int pageStart = (queryInfo.getPageNum()-1)*queryInfo.getPageSize();
- List<Showdate> dates = showdateDao.getAlldate("%"+queryInfo.getQuery()+"%",pageStart,queryInfo.getPageSize());
-
- for(int i =0;i<dates.size();i++){
- System.out.println(dates.get(i).toString());
- }
- //校验
- //封装校验后的流量日志
- HashMap<String, Object> res = new HashMap<>();
- res.put("flag","success");
- res.put("opinionData2",dates );
- String date_json= JSON.toJSONString(res);
- System.out.println(date_json.toString());
- return date_json;
- }
-
- //数据库数据来源的实现方法,就是改变数据库表Date1中得数据
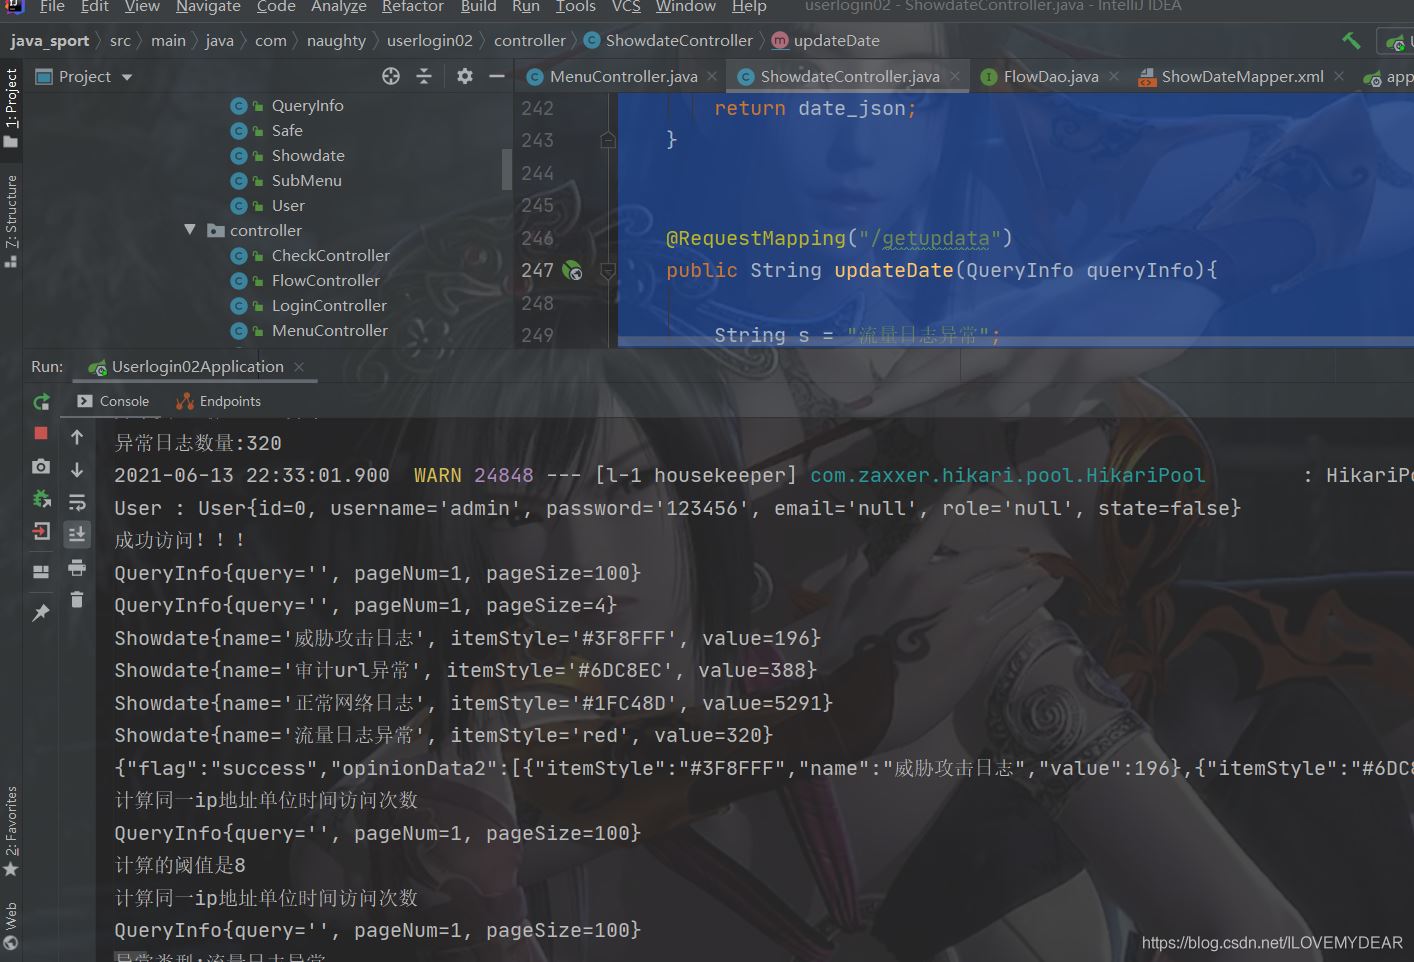
- @RequestMapping("/getupdata")
- public String updateDate(QueryInfo queryInfo){
-
- String s = "流量日志异常";
- String s1 ="审计url异常";
- String s2 ="威胁攻击日志";
- String s3 ="正常网络日志";
- /*int count = getUserList(queryInfo);
- int count1 =getChickList(queryInfo); //四个方法需要你自己根据具体业务实现
- int count2 =getSafeDate(queryInfo);
- int count3 =allBlognum(queryInfo)-(count+count1+count2);*/
- showdateDao.updatenew(s,count);
- showdateDao.updatenew(s1,count1);
- showdateDao.updatenew(s2,count2);
- int i= showdateDao.updatenew(s3,count3);
- System.out.println("异常类型:"+s);
- System.out.println("异常日志数量:"+count);
- String str = i >0?"success":"error";
- return str;
- }
-
- }
-
3.2.6 修改前端接口
Js全部代码:
- <script>
- import * as echarts from 'echarts'
- export default {
- name: 'test2',
- data () {
- return {
- queryInfo: {
- query: "",
- pageNum: 1,
- pageSize: 4,
- },
- queryInfof: {
- query: "",
- pageNum: 1,
- pageSize: 100,
- },
- myChart: '',
- opinionData2: [
-
- //清空前端测试数据
- ]
- }
- },
- mounted: function () {
- this.drawLine();
-
- },
- created() {
- this.getdateList(); //每次进入页面刷新数据库数据实现动态数据绑定
- },
- methods: {
- async drawLine () {
- // 调用post请求,获得后台数据库的数值
- const { data: res } = await this.$http.get("alldate", {
- params: this.queryInfo
- });
- if (res.flag != "success") {
- return this.$message.error("该数据获取失败!!!");
- }
-
- console.log(res.flag)
- this.opinionData2 = res.opinionData2; // 将返回数据赋值
- this.myChart = echarts.init(document.getElementById('myChart'))
- this.myChart.setOption({
- title: {
- text: '网络日志异常流量分析', // 主标题
- subtext: '', // 副标题
- x: 'left' // x轴方向对齐方式
- },
- grid: { containLabel: true },
- tooltip: {
- trigger: 'item',
- formatter: '{a} <br/>{b} : {d}%'
- },
- // color: ['#1FC48D', '#F5A60A', '#6DC8EC', '#3F8FFF'],
- color: ['#1FC48D', 'red', '#6DC8EC', '#3F8FFF'],
- // backgroundColor: '#ffffff',
- legend: {
- orient: 'vertical',
- icon: 'circle',
- align: 'left',
- x: 'right',
- y: 'bottom',
- data: ['审计url异常', '正常网络日志', '流量日志异常', '威胁攻击日志']
- },
- series: [
- {
- name: '网络日志状态',
- type: 'pie',
- radius: ['50%', '70%'],
- avoidLabelOverlap: false,
- center: ['40%', '50%'],
- itemStyle: {
- emphasis: {
- shadowBlur: 10,
- shadowOffsetX: 0,
- shadowColor: 'rgba(0, 0, 0, 0.5)'
- },
- color: function (params) {
- // 自定义颜色
- var colorList = ['#1FC48D', 'red', '#6DC8EC', '#3F8FFF']
- return colorList[params.dataIndex]
- }
- },
- data: this.opinionData2
- }
- ]
- })
- },
- async getdateList() {
- // 调用post请求
- const { data: res } = await this.$http.get("getupdata", {
- params: this.queryInfof
- });
- if (res != "success") {
- return this.$message.error("该数据获取失败!!!");
- }
- console.log(res)
- },
- }
- }
- </script>
-

后台返回数据:
到此这篇关于Springboot运用vue+echarts前后端交互实现动态圆环图的文章就介绍到这了,更多相关Springboot vue动态圆环图 内容请搜索w3xue以前的文章或继续浏览下面的相关文章希望大家以后多多支持w3xue!
